
 |
Manual |
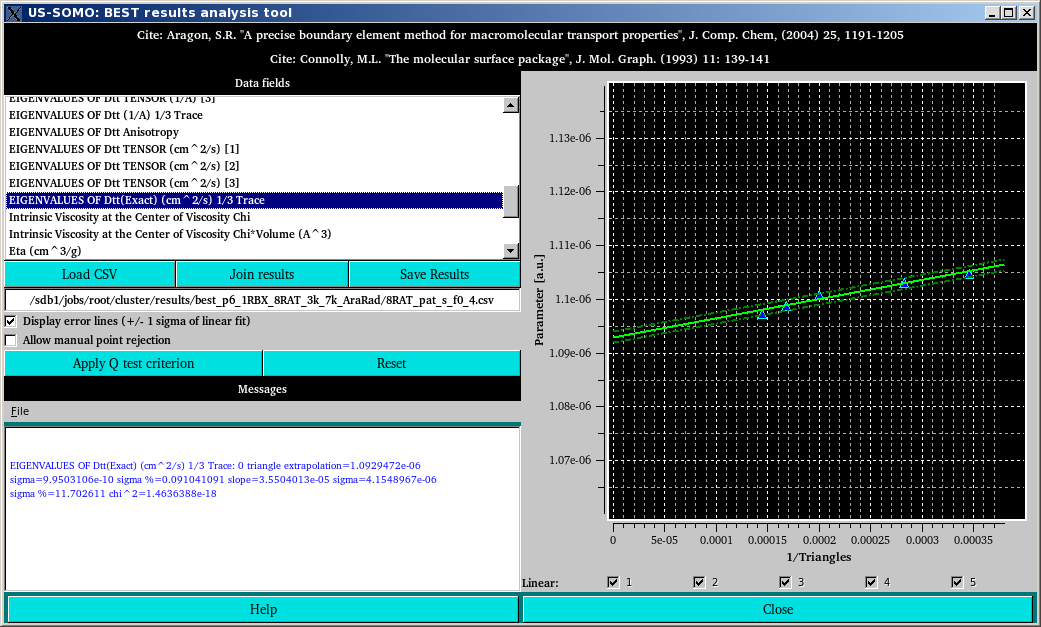
This module was conceived to allow for an in depth evaluation of the hydrodynamic parameters computed by BEST, and to provide some useful tools for their further treatment. At the end of the computational phase in the supercompute cluster, the calculated hydrodynamic parameters for every triangulated model and their zero plates values as extrapolated by BEST are saved in a CSV file which is retrieved together with a series of other produced files as described in the BEST cluster setup help results section.
Furthermore, we have added the calculation of the 5 individual rotational correlation times [Tau(1), etc.], and of their normal and harmonic means [Tau(m) and Tau(h)] from the Eigenvalues of the rotational diffusion tensor (See Spotorno et al., Eur. Biophys. J. 25:373-384, 1997).
After launching the BEST data analysis module from the US-SOMO main panel, the first operation is then to upload one BEST results CSV file by pressing Load CSV and navigating through the files directory. When a CSV file is loaded, the Data fields space is populated by the complete list of all the available parameters, and by clicking on one of them the relative plot of that parameter's values vs. 1/triangles is shown in the right-side graphics window together with a linear regression line. The results of the regression are shown in the Messages section at the bottom left-side of this module, and are continuosly updated when changes are made to the number of points included in the regression (see below).
The two dotted lines above and below the solid regression line in the plot are plotted by selecting the Display error lines (+/- 1 sigma of linear fit) checkbox.
To see the effect of including or excluding points in the regression, an Allow manual point rejection checkbox is provided. If it is activated, the checkboxes relative to the points included in the regression, located at the bottom of the graphics display, become active, and will allow to deselect/select every point or combination of points. Obviously, a minimum of two points is required for the regression to take place, with its results displayed in the Messages section. WARNING: The use of the manual point rejection to produce final extrapolated results is severely discouraged! See the "Apply Q test criterion" below.
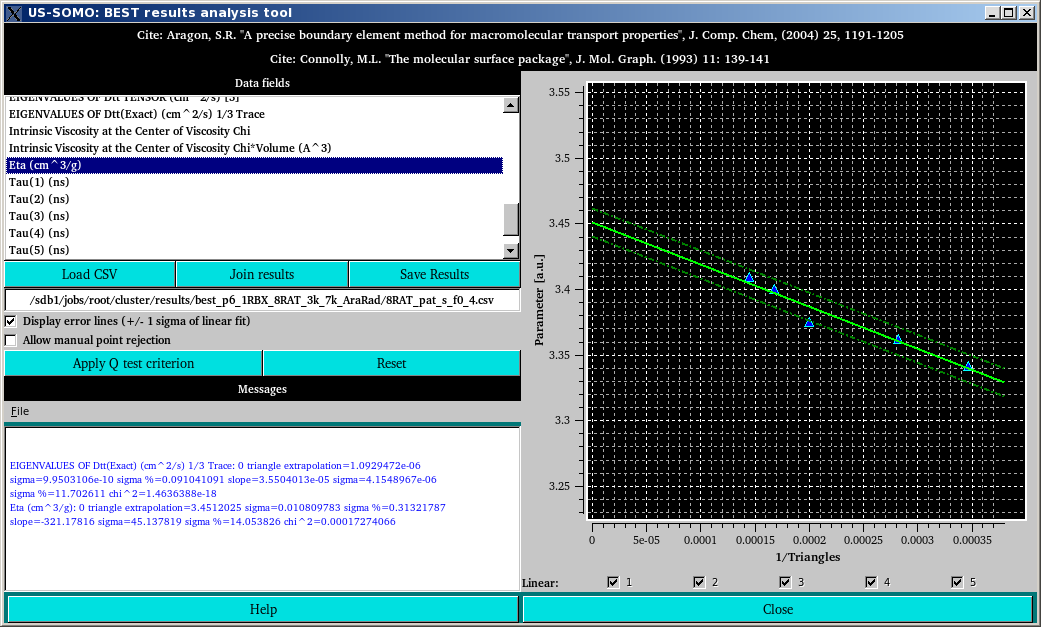
In some cases, one or more apparent outliers will appear in the calculated parameter vs. 1/triangles plot, as shown above for the [η] values. In such a case, a statistical test called the Q-test [Dixon, WJ (1951) Ratios involving extreme values. Ann Math Stat 22:68-78] should be called by pressing the Apply Q test criterion button. This test will identify a single true outlier, if it exists, matching the Q-test criterion, which will be indentified with a X on the plot, and its corresponding checkbox will be automatically deselected, as shown below:
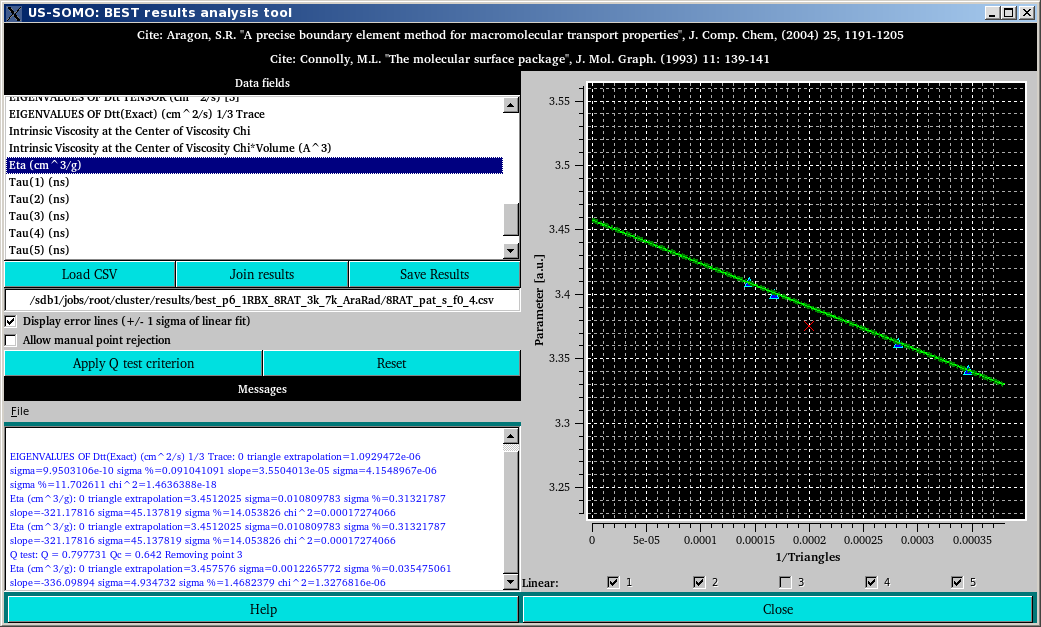
Note that in the Messages section an updated extrapolated value for [η] is reported. This type of analysis can be performed independently for every parameter listed in the Data fields section. If more than a single outlier is visually evident, it is strongly suggested to perform again a BEST computation by varying, for instance, the starting and ending number of triangles, or the number of files generated. Note also that the derivation of the rotational correlation times Tau(1), Tau(2), etc., and of their normal and harmonic means (Tau(m) and Tau(h), respectively) is originally made from the extrapolated values or the Drr Eigenvalues provided by BEST and present in the uploaded CSV file. Therefore, it is better to first check the goodness of the extrapolation of the individual Drr Eigenvalues before checking the individual Tau and their means. The US-SOMO BEST Analysis Module will recompute the individual Tau and their means each time the extrapolation of a Drr Eigenvalue is changed.
Once all the necessary extrapolation checks have been performed, and updated CSV file containing the final parameters can be saved by pressing Save Results. To the original filename, the "results" string will be appended before the ".csv" extension.
When NMR-style files are analyzed via the US-SOMO BEST implementation, a CSV file is produced for each model, that can then be analyzed with the US-SOMO BEST Analysis Module. However, often an average value of one or more hydrodynamic parameters is sought across all the models contained in a NMR-style file. To help producing each average, the Join results button is provided. Pressing it will bring up the filesystem navigator, and after reaching the appropriate directory, files can be selected (ctrl-left click), followed by pressing "open":
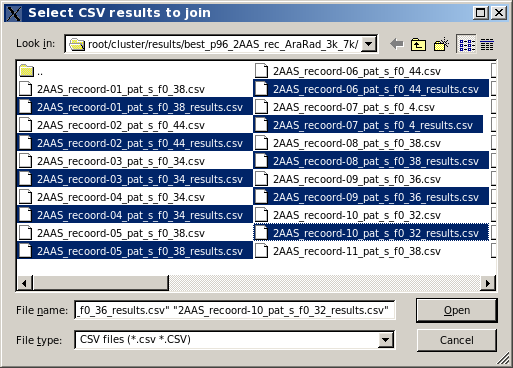
The filesystem will then allow for more files to be added, either in the same or in another directory. If no more files are to be added, pressing "cancel" will bring back the filesystem navigator so that an output directory filename can be entered:
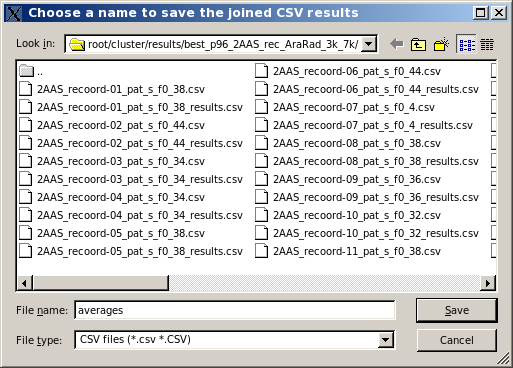
The resulting CSV file will list all the values for the same parameter for each different model in contiguous lines, and for all the parameters, allowing to easily generate the required averages with any standard spreadsheet program. In the image below, a section of a spreadsheet with the results obtained for the Eigenvalues of Dtt from the US-SOMO BEST Analysis Module on 32 NMR models of RNase A is shown:
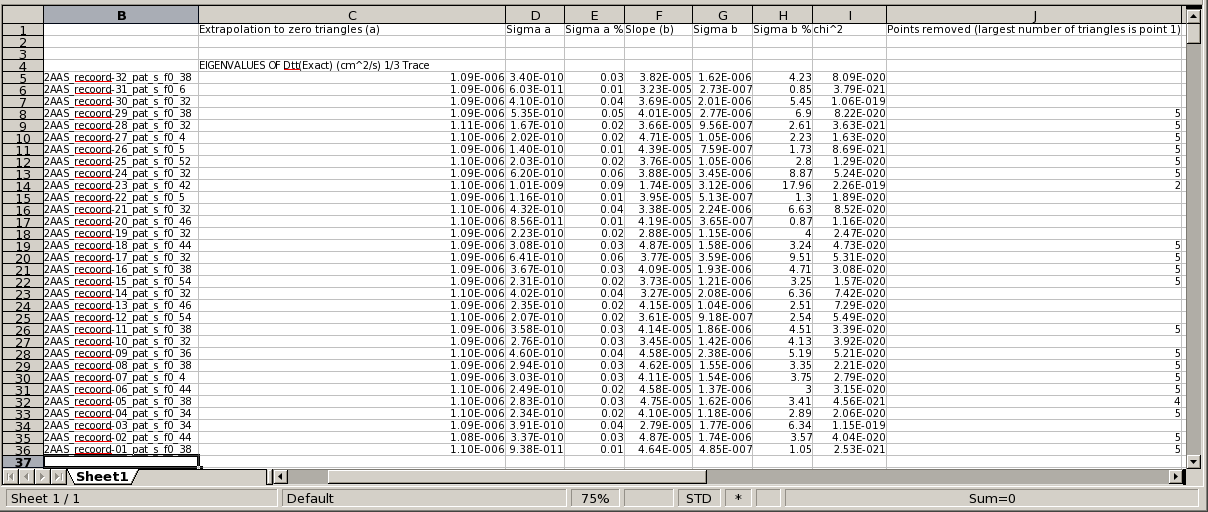
Note that the last column lists the single points that have been dropped from each regression (in case of the non-recommended manual multiple points exclusion, all the discarded points will be listed separated by commas).
This document is part of the UltraScan Software Documentation
distribution.
Copyright © notice.
The latest version of this document can always be found at:
Last modified on May 11, 2014